Maybe you did, more likely you didn't.
In any case it has nothing to do with the op's query, so I don't see the point you are attempting to make.

Maybe you did, more likely you didn't.
In any case it has nothing to do with the op's query, so I don't see the point you are attempting to make.
Perhaps start your own thread if you need help with something instead of attempting to hijack this thread.

I had always assumed that it was a consequence of limited in-camera processing power - or that the developers prioritised other things to use the available power to the greatest advantage.

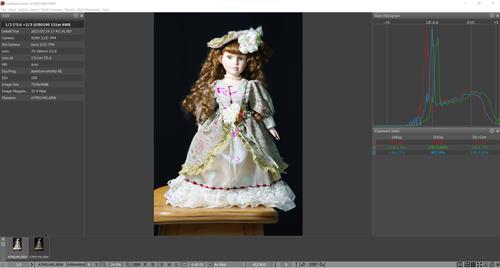
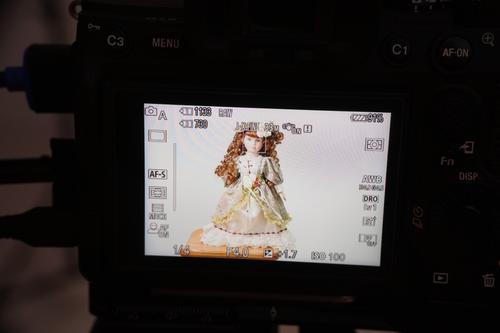
A histogram is a bar graph of the distribution of some value. For pictures, it's the distribution of tones in the image, from darkest to lightest.
"Zebras" are the shading put over areas of the image in the viewfinder, nominally to show where highlights are being pushed past the sensor's capability to resolve them, or more informally, "being blown".
Histograms can show where highlights are being blown, if enough pixels are in that state the right side of the histogram will show a spike. But if the blown regions are small and/or the image is of a really high resolution, the spike might not be apparent, especially in the small histogram in the viewfinder.

@WhyNot - this answer Jim gives here is the most concise, not-overly-technical & pragmatic answer to your question. The rest is (mostly) details.
Said somewhat differently, you have a higher risk of blown highlights (in some situations) when relying on the in-camera histogram that has already undergone all the processing steps that ILIAH enumerated above… as opposed to if you were able to rely on a truly raw histogram.
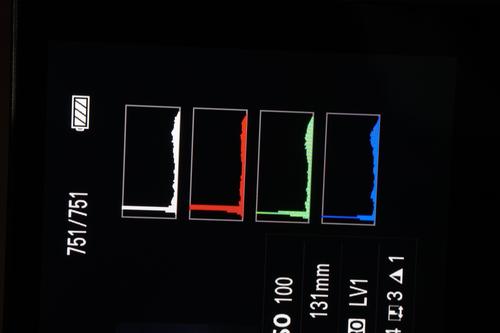
If you rely on the in-camera RGB histogram, you never get blown highlights (well unless there's a little amount of blown pixels below histogram's resolution). Main problem with the in-camera histogram is it shows highlight clipping when there's no clipping in raw.

That is not my experience with Sony, Nikon, Leica, Hasselblad, and Fuji cameras.
That's the classic view, but photographic histograms are often presented in other formats than bar graphs. Look at FRV, or Lr.
What conditions would cause an RGB histogram (that shows three separate channels) to show no clipping when there's clipping in raw?
I saw it at extented ISO 50 in Canon but it's a special case.
If the lighting is well away from D55. If the subject highlights have high chroma, particularly in the reds and blues. If the camera white balance is set aggressively away from common values, or auto WB does that.
Yeah, many cameras' fake ISOs do that by design.

Under some lights, a WB coeff. can be < 1.
Yeah, I use a line graph in rawproc so the three channels can be easily considered. I like to point out the bar graph thing because histograms are about "buckets", discrete values, where sometimes I think we forget that and consider the depiction as a continuum...
The depiction I still can't wrap my head around is the waveform. I need to do some reading on it sometime, right now to me they just look like some psychedelic morphosis. 😆
That's very interesting, thanks @IliahBorg @JimKasson
When I'm writing the code and want to display multiple channels, I find a scatter plot the most useful. That preserves the "buckets".
I think that's for people who started out with analog video. Kinda like D-logE sensitometry curves make the most sense to people who have Zone System experience.

The simplest possible answer to the question of what a raw histogram can be used for is that it can reveal if my exposure might be too little or too much. Both of those scenarios can lead to images that are not satisfactory for my purposes. In a nutshell, this is about maximizing this one aspect of image quality.
Underexposed images will look too dark unless they are made brighter, but if I bring the brightness up I also reveal the inherent noise more prominently. On the other hand if the exposure was too much there will be portions of the image that are blown out to pure white and have no detail, or just as bad, some but not all of the individual color channels will be blown out, which throws off the ratio of, say, red to blue, and then the colors of that part of the image will be wrong… sometimes by a lot.
I could set myself a goal of exposing as much as possible (to avoid excessively noisy image appearance) without going even just a little bit too far.
I really like the Blackjack analogy Jim used in his article. The goal is to beat the dealer so the higher the number total from my cards, the better my chances will be - up to a point! When I used to play it the dealers seem to be magnetically fated towards obtaining a count of 20. In that case I would need 20 to break even, or 21 to win. That’s enough to make me sweat. But if I draw a count of 22 or more I will have immediately lost the hand.
I could take a cautious approach by not asking for another card once I’ve reached a count of 16 and then I won’t “go bust” but that won’t fare well against a dealer’s total of 17, 18, 19, 20, or 21. That’s the conservative approach taken by most camera meters, in spite of the fact that the in-camera histogram is proudly claiming that I am at “20”. The camera hasn’t been calibrated to take me to “20” or “21”, because it might accidentally get to “22” which is very bad. So I have to settle with a “16” image and I will probably be bumping up the brightness, so here comes the noise.
This is where I bend the Blackjack analogy’s numeric model a little: if I had a raw histogram in camera I could bring my exposure up to “20.9” which would be a “winning hand” a very high percentage of times.